Question
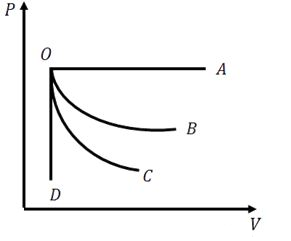
A graph of pressure versus volume for an ideal gas undergoing different processes is shown. In the graph, curve OC represents
A graph of pressure versus volume for an ideal gas undergoing different processes is shown. In the graph, curve OC represents