Question
Which of the following graphs correctly represents the variation of heat energy ($ U $) produced in a metallic conductor in a given time as a function of potential difference ($ V $) across the conductor?
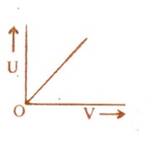
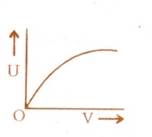
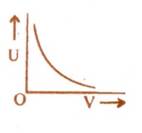
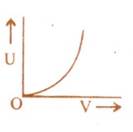
Which of the following graphs correctly represents the variation of heat energy ($ U $) produced in a metallic conductor in a given time as a function of potential difference ($ V $) across the conductor?