Question
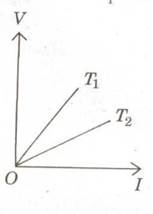
The voltage $ V $ and current $ I $ graphs for a conductor at two different temperatures $ T_1 $ and $ T_2 $ are shown in the figure. The relation between $ T_1 $ and $ T_2 $ is ............
The voltage $ V $ and current $ I $ graphs for a conductor at two different temperatures $ T_1 $ and $ T_2 $ are shown in the figure. The relation between $ T_1 $ and $ T_2 $ is ............