Question
Which of the following curves represents the variation of the coefficient of volume expansion of an ideal gas at constant pressure?
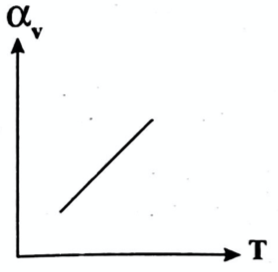
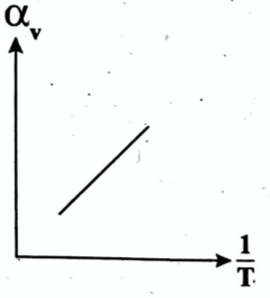
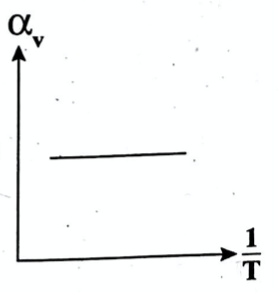
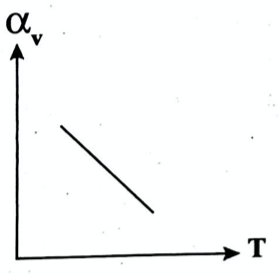
Which of the following curves represents the variation of the coefficient of volume expansion of an ideal gas at constant pressure?