Question
Which graph in the following diagrams correctly represents the potential energy of a pair of nucleons as a function of their separation?
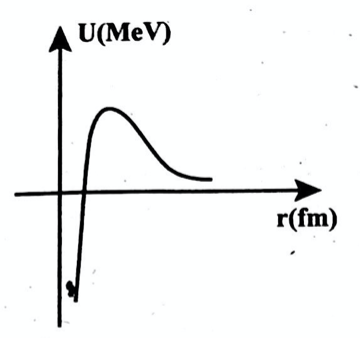
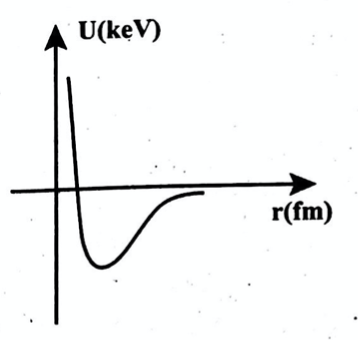
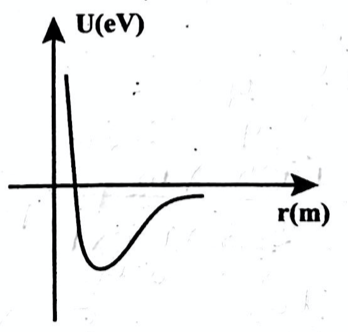
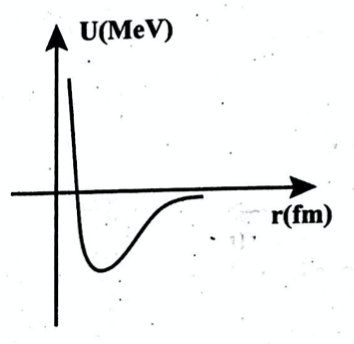
Which graph in the following diagrams correctly represents the potential energy of a pair of nucleons as a function of their separation?