Question
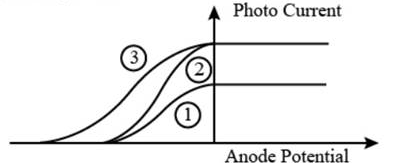
The following graph represents the variation of $ \text{photocurrent} $ with anode potential for a metal surface. Here $ I_1 $, $ I_2 $, and $ I_3 $ represent intensities, and $ \gamma_1 $, $ \gamma_2 $, $ \gamma_3 $ represent frequencies for curves 1, 2, and 3 respectively.