Question
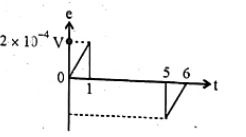
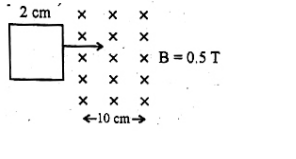
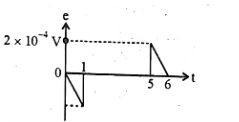
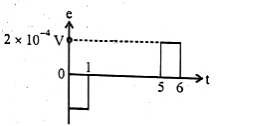
A square loop of side $2 \, \text{cm}$ enters a magnetic field with a constant speed of $2 \, \text{cm/s}$ as shown. The front edge enters the field at $t=0 \, \text{s}$. Which of the following graphs correctly depicts the induced emf in the loop?
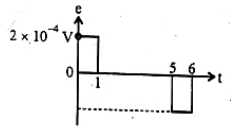
Graph showing a gradual increase from $t=0$ to $t=1$ and zero elsewhere.