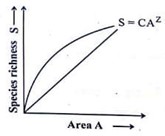
The given graph represents
Species area relationship
Enzyme activity
Growth of organisms
Population growth
Please login to view the detailed solution steps...
Subject Backlinks
Quiz Backlink
Related Question Backlinks